Virtual ML.Net: Part-1 COVID-19 Data Analysis using .Net DataFrame API
Part-1: COVID-19 Data Analysis using .Net DataFrame API
COVID-19
- As per Wiki Coronavirus disease 2019 (COVID-19) is an infectious disease caused by severe acute respiratory syndrome coronavirus 2 (SARS-CoV-2). The disease was first identified in 2019 in Wuhan, the capital of China’s Hubei province, and has since spread globally, resulting in the ongoing 2019–20 coronavirus pandemic.
- The virus had caused a pandemic across the globe and spreading/affecting most of the nations.
- The purpose of notebook is to visualize the trends of virus spread in various countries and explore features present in ML.Net such as DataFrame.
Acknowledgement
- Johns Hopkins CSSE for dataset
- COVID-19 data visualization by Akshay Sb
Dataset
Introduction
DataFrame: DataFrame is a new type introduced in .Net. It is similar to DataFrame in Python which is used to manipulate data in notebooks. It’s a collection of columns containing data similar to a table and very helpful in analyzing tabular data. It works flawlessly without creating types/classes mapped to columns in a table which we used to do with ML.Net. It has support for GroupBy, Sort, Filter which makes analysis very handy. It’s a in-memory representation of structured data.
In this tutorial we’ll cover below features
- Load a CSV
- Metadata
- Description
- Info
- Display records
- Head
- Sample
- Filtering
- Grouping
- Aggregate
For overview, please refer below links
Part-2 covers time series analysis and prediction using ML.Net
Summary
Below is the summary of steps we’ll be performing
- Define application level items
- Nuget packages
- Namespaces
- Constants
- Utility Functions
- Formatters
- Load Dataset
- Download Dataset from Johns Hopkins CSSE
- Load dataset in DataFrame
- Analyze Data
- Date Range
- Display Dataset - display(dataframe)
- Display Top 5 Rows - dataframe.Head(5)
- Display Random 6 Rows - dataframe.Sample(6)
- Display Dataset Statistics - dataframe.Description()
- Display Dataset type information - dataframe.Info()
- Data Cleaning
- Remove Invalid cases
- Data Visualization
- Global
- Confirmed Vs Deaths Vs Recovered
- Top 5 Countries with Confirmed cases
- Top 5 Countries with Death cases
- Top 5 Countries with Recovered cases
- India
- Confirmed Vs Deaths Vs Recovered
- Global
Note : Graphs/Plots may not render in GitHub due to security reasons, however if you run this notebook locally/binder they will render.
1. Define Application wide Items
Nuget Packages
// ML.NET Nuget packages installation
#r "nuget:Microsoft.ML"
#r "nuget:Microsoft.Data.Analysis"

// Install XPlot package
#r "nuget:XPlot.Plotly"

// CSV Helper Package for reading CSV
#r "nuget:CsvHelper"
Installed package XPlot.Plotly version 3.0.1
Installed package Microsoft.Data.Analysis version 0.4.0
Installed package CsvHelper version 15.0.5
Installed package Microsoft.ML version 1.5.0
Namespaces
using Microsoft.ML;
using Microsoft.ML.Data;
using Microsoft.Data.Analysis;
using Microsoft.AspNetCore.Html;
using System.IO;
using System.Net.Http;
using System.Globalization;
using CsvHelper;
using CsvHelper.Configuration;
using XPlot.Plotly;
Constants
// Column Names
const string FIPS = "FIPS";
const string ADMIN = "Admin2";
const string STATE = "Province_State";
const string COUNTRY = "Country_Region";
const string LAST_UPDATE = "Last_Update";
const string LATITUDE = "Lat";
const string LONGITUDE = "Long_";
const string CONFIRMED = "Confirmed";
const string DEATHS = "Deaths";
const string RECOVERED = "Recovered";
const string ACTIVE = "Active";
const string COMBINED_KEY = "Combined_Key";

// File
const string DATASET_FILE = "05-27-2020";
const string FILE_EXTENSION = ".csv";
const string NEW_FILE_SUFFIX = "_new";
const char SEPARATOR = ',';
const char SEPARATOR_REPLACEMENT = '_';
const string DATASET_GITHUB_DIRECTORY = "https://raw.githubusercontent.com/CSSEGISandData/COVID-19/master/csse_covid_19_data/csse_covid_19_daily_reports/";

// DataFrame/Table
const int TOP_COUNT = 5;
const int DEFAULT_ROW_COUNT = 10;
const string VALUES = "Values";
const string INDIA = "India";
2. Utility Functions
Formatters
By default the output of DataFrame is not proper and in order to display it as a table, we need to have a custom formatter implemented as shown in next cell.
// Formats the table

Formatter<DataFrame>.Register((df, writer) =>
{
    var headers = new List<IHtmlContent>();
    headers.Add(th(i("index")));
    headers.AddRange(df.Columns.Select(c => (IHtmlContent) th(c.Name)));
    var rows = new List<List<IHtmlContent>>();
    var take = DEFAULT_ROW_COUNT;
    for (var i = 0; i < Math.Min(take, df.Rows.Count); i++)
    {
        var cells = new List<IHtmlContent>();
        cells.Add(td(i));
        foreach (var obj in df.Rows[i])
        {
            cells.Add(td(obj));
        }
        rows.Add(cells);
    }

    var t = table(
        thead(
            headers),
        tbody(
            rows.Select(
                r => tr(r))));

    writer.Write(t);
}, "text/html");
Copy dataset csv and replace Separator in cells
// Replace a characeter in a cell of csv with a defined separator
private void CreateCsvAndReplaceSeparatorInCells(string inputFile, string outputFile, char separator, char separatorReplacement)
{
    var culture = CultureInfo.InvariantCulture;
    using var reader = new StreamReader(inputFile);
    using var csvIn = new CsvReader(reader, new CsvConfiguration(culture));
    using var recordsIn = new CsvDataReader(csvIn);
    using var writer = new StreamWriter(outputFile);
    using var outCsv = new CsvWriter(writer, culture);

    // Write Header
    csvIn.ReadHeader();
    var headers = csvIn.Context.HeaderRecord;
    foreach (var header in headers)
    {
        outCsv.WriteField(header.Replace(separator, separatorReplacement));
    }
    outCsv.NextRecord();

    // Write rows
    while (recordsIn.Read())
    {
        var columns = recordsIn.FieldCount;
        for (var index = 0; index < columns; index++)
        {
            var cellValue = recordsIn.GetString(index);
            outCsv.WriteField(cellValue.Replace(separator, separatorReplacement));
        }
        outCsv.NextRecord();
    }
}
3. Load Dataset
Download Dataset from Johns Hopkins CSSE
We’ll be using COVID-19 dataset from Johns Hopkins CSSE. The csse_covid_19_data directory has .csv file for each day and we’ll be performing analysis on latest file present. Latest file present at the time of last modification of this notebook was 05-27-2020.csv. If you wish to use a different file, update DATASET_FILE constant in Constants cell above.
We’ll download file to current directory.
// Download csv from github
var originalFileName = $"{DATASET_FILE}{FILE_EXTENSION}";
if (!File.Exists(originalFileName))
{
    var remoteFilePath = $"{DATASET_GITHUB_DIRECTORY}/{originalFileName}";
    display(remoteFilePath);
    var contents = new HttpClient()
        .GetStringAsync(remoteFilePath).Result;

    File.WriteAllText(originalFileName, contents);
}
https://raw.githubusercontent.com/CSSEGISandData/COVID-19/master/csse_covid_19_data/csse_covid_19_daily_reports//05-27-2020.csv
Load dataset in DataFrame
Issue: We can load csv using LoadCsv(..) method of DataFrame. However, there is an issue of not allowing quotes and separator(comma in this case) in a cell value. The dataset, we are using has both of them and LoadCsv fails for it. As a workaround, we’ll use CSVHelper to read the csv file and replace command separator with underscore, save the file and use it to load in DataFrame LoadCsv(..) method.
// Load and create a copy of dataset file
var newFileName = $"{DATASET_FILE}{NEW_FILE_SUFFIX}{FILE_EXTENSION}";
display(newFileName);
CreateCsvAndReplaceSeparatorInCells(originalFileName, newFileName, SEPARATOR, SEPARATOR_REPLACEMENT);
05-27-2020_new.csv
var covid19Dataframe = DataFrame.LoadCsv(newFileName);
4. Data Analysis
Data analysis is a critical activity in the field of Data science. It provides ways to uncover the hidden attributes of a dataset which can’t be analyzed or predicted by simply looking at the data source. DataFrame makes the analysis simple by providing great API’s such as GroupBy, Sort, Filter etc. Jupyter notebook is great tool for this kind of activity which maintains values of variables executed in a cell and providing it to other cells.
Finding the range in the records in Dataset
In DataFrame, Columns property allows access to values within a column by specifying column name. we’ll use Last_Update column to get the date and sort it to get the start and end date
// Gets the data range

var dateRangeDataFrame = covid19Dataframe.Columns[LAST_UPDATE].ValueCounts();
var dataRange = dateRangeDataFrame.Columns[VALUES].Sort();
var lastElementIndex = dataRange.Length - 1;

var startDate = DateTime.Parse(dataRange[0].ToString()).ToShortDateString();
var endDate  = DateTime.Parse(dataRange[lastElementIndex].ToString()).ToShortDateString(); // Last Element

display(h4($"The data is between {startDate} and {endDate}"));
The data is between 5/28/2020 and 5/28/2020
Display 10 records
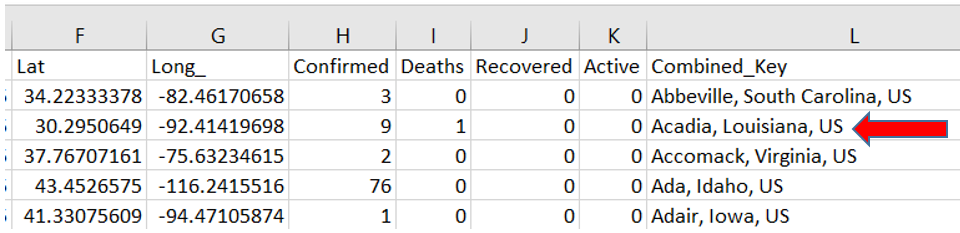
Here we have 12 columns which includes Country, State, Confirmed, Deaths, Recovered and Active cases
display(covid19Dataframe)
| index | FIPS | Admin2 | Province_State | Country_Region | Last_Update | Lat | Long_ | Confirmed | Deaths | Recovered | Active | Combined_Key |
|---|---|---|---|---|---|---|---|---|---|---|---|---|
| 0 | 45001 | Abbeville | South Carolina | US | 2020-05-28 02:32:31 | 34.223335 | -82.46171 | 35 | 0 | 0 | 35 | Abbeville_ South Carolina_ US |
| 1 | 22001 | Acadia | Louisiana | US | 2020-05-28 02:32:31 | 30.295065 | -92.4142 | 397 | 22 | 0 | 375 | Acadia_ Louisiana_ US |
| 2 | 51001 | Accomack | Virginia | US | 2020-05-28 02:32:31 | 37.76707 | -75.63235 | 780 | 12 | 0 | 768 | Accomack_ Virginia_ US |
| 3 | 16001 | Ada | Idaho | US | 2020-05-28 02:32:31 | 43.452656 | -116.241554 | 798 | 22 | 0 | 776 | Ada_ Idaho_ US |
| 4 | 19001 | Adair | Iowa | US | 2020-05-28 02:32:31 | 41.330757 | -94.47106 | 7 | 0 | 0 | 7 | Adair_ Iowa_ US |
| 5 | 21001 | Adair | Kentucky | US | 2020-05-28 02:32:31 | 37.1046 | -85.281296 | 96 | 19 | 0 | 77 | Adair_ Kentucky_ US |
| 6 | 29001 | Adair | Missouri | US | 2020-05-28 02:32:31 | 40.190586 | -92.600784 | 46 | 0 | 0 | 46 | Adair_ Missouri_ US |
| 7 | 40001 | Adair | Oklahoma | US | 2020-05-28 02:32:31 | 35.88494 | -94.65859 | 82 | 3 | 0 | 79 | Adair_ Oklahoma_ US |
| 8 | 8001 | Adams | Colorado | US | 2020-05-28 02:32:31 | 39.87432 | -104.33626 | 3006 | 118 | 0 | 2888 | Adams_ Colorado_ US |
| 9 | 16003 | Adams | Idaho | US | 2020-05-28 02:32:31 | 44.893337 | -116.45452 | 3 | 0 | 0 | 3 | Adams_ Idaho_ US |
Display Top 5 records
covid19Dataframe.Head(5)
| index | FIPS | Admin2 | Province_State | Country_Region | Last_Update | Lat | Long_ | Confirmed | Deaths | Recovered | Active | Combined_Key |
|---|---|---|---|---|---|---|---|---|---|---|---|---|
| 0 | 45001 | Abbeville | South Carolina | US | 2020-05-28 02:32:31 | 34.223335 | -82.46171 | 35 | 0 | 0 | 35 | Abbeville_ South Carolina_ US |
| 1 | 22001 | Acadia | Louisiana | US | 2020-05-28 02:32:31 | 30.295065 | -92.4142 | 397 | 22 | 0 | 375 | Acadia_ Louisiana_ US |
| 2 | 51001 | Accomack | Virginia | US | 2020-05-28 02:32:31 | 37.76707 | -75.63235 | 780 | 12 | 0 | 768 | Accomack_ Virginia_ US |
| 3 | 16001 | Ada | Idaho | US | 2020-05-28 02:32:31 | 43.452656 | -116.241554 | 798 | 22 | 0 | 776 | Ada_ Idaho_ US |
| 4 | 19001 | Adair | Iowa | US | 2020-05-28 02:32:31 | 41.330757 | -94.47106 | 7 | 0 | 0 | 7 | Adair_ Iowa_ US |
Display Random 6 records
covid19Dataframe.Sample(6)
| index | FIPS | Admin2 | Province_State | Country_Region | Last_Update | Lat | Long_ | Confirmed | Deaths | Recovered | Active | Combined_Key |
|---|---|---|---|---|---|---|---|---|---|---|---|---|
| 0 | 18025 | Crawford | Indiana | US | 2020-05-28 02:32:31 | 38.288143 | -86.44519 | 23 | 0 | 0 | 23 | Crawford_ Indiana_ US |
| 1 | 51065 | Fluvanna | Virginia | US | 2020-05-28 02:32:31 | 37.84158 | -78.27715 | 87 | 6 | 0 | 81 | Fluvanna_ Virginia_ US |
| 2 | 13241 | Rabun | Georgia | US | 2020-05-28 02:32:31 | 34.883896 | -83.403046 | 17 | 1 | 0 | 16 | Rabun_ Georgia_ US |
| 3 | 12003 | Baker | Florida | US | 2020-05-28 02:32:31 | 30.3306 | -82.284676 | 29 | 3 | 0 | 26 | Baker_ Florida_ US |
| 4 | 21133 | Letcher | Kentucky | US | 2020-05-28 02:32:31 | 37.123066 | -82.85346 | 4 | 0 | 0 | 4 | Letcher_ Kentucky_ US |
| 5 | 12077 | Liberty | Florida | US | 2020-05-28 02:32:31 | 30.23766 | -84.88293 | 209 | 0 | 0 | 209 | Liberty_ Florida_ US |
Display Dataset Statistics such as Total, Max, Min, Mean of items in a column
covid19Dataframe.Description()
| index | Description | FIPS | Lat | Long_ | Confirmed | Deaths | Recovered | Active |
|---|---|---|---|---|---|---|---|---|
| 0 | Length (excluding null values) | 3009 | 3346 | 3346 | 3414 | 3414 | 3414 | 3414 |
| 1 | Max | 99999 | 71.7069 | 178.065 | 370680 | 37460 | 391508 | 229780 |
| 2 | Min | 0 | -52.368 | -164.03539 | 0 | 0 | 0 | -364117 |
| 3 | Mean | 27622.38 | 35.3851 | -78.927086 | 1667.1909 | 104.16784 | 688.3679 | 882.6784 |
Display Dataset type information for each column
covid19Dataframe.Info()
| index | Info | FIPS | Admin2 | Province_State | Country_Region | Last_Update | Lat | Long_ | Confirmed | Deaths | Recovered | Active | Combined_Key |
|---|---|---|---|---|---|---|---|---|---|---|---|---|---|
| 0 | DataType | System.Single | System.String | System.String | System.String | System.String | System.Single | System.Single | System.Single | System.Single | System.Single | System.Single | System.String |
| 1 | Length (excluding null values) | 3009 | 3414 | 3414 | 3414 | 3414 | 3346 | 3346 | 3414 | 3414 | 3414 | 3414 | 3414 |
5. Data Cleaning
Data Cleaning is another important activity in which remove the irrelevant data present in our dataset. This irrelevant data can be due missing values, invalid values or an outlier. The columns with less significance is removed for better analysis and prediction of our data. In order to keep this notebook simple, we’ll use one of the techniques to remove invalid data. In this we are going to remove invalid Active cases such as the ones having negative values. The other techniques we can apply on data could be DropNull to remove rows with null values, FillNull to fill null values with other such as mean, average. We can transform DataFrame and remove some of the unnecessary columns.
Remove invalid Active cases
covid19Dataframe.Description()
| index | Description | FIPS | Lat | Long_ | Confirmed | Deaths | Recovered | Active |
|---|---|---|---|---|---|---|---|---|
| 0 | Length (excluding null values) | 3009 | 3346 | 3346 | 3414 | 3414 | 3414 | 3414 |
| 1 | Max | 99999 | 71.7069 | 178.065 | 370680 | 37460 | 391508 | 229780 |
| 2 | Min | 0 | -52.368 | -164.03539 | 0 | 0 | 0 | -364117 |
| 3 | Mean | 27622.38 | 35.3851 | -78.927086 | 1667.1909 | 104.16784 | 688.3679 | 882.6784 |
From the above description table, we could see negative value for Active cases which seems to be incorrect as number of active cases is cases is calculated by the below formula
Active = Confirmed - Deaths - Recovered
In order to check for invalid active cases, we’ll use DataFrame Filter to retrieve active column values whose value is less than 0.0
// Filter : Gets active records with negative calues

PrimitiveDataFrameColumn<bool> invalidActiveFilter = covid19Dataframe.Columns[ACTIVE].ElementwiseLessThan(0.0);
var invalidActiveDataFrame = covid19Dataframe.Filter(invalidActiveFilter);
display(invalidActiveDataFrame)
| index | FIPS | Admin2 | Province_State | Country_Region | Last_Update | Lat | Long_ | Confirmed | Deaths | Recovered | Active | Combined_Key |
|---|---|---|---|---|---|---|---|---|---|---|---|---|
| 0 | 90004 | Unassigned | Arizona | US | 2020-05-28 02:32:31 | <null> | <null> | 0 | 2 | 0 | -2 | Unassigned_ Arizona_ US |
| 1 | 90018 | Unassigned | Indiana | US | 2020-05-28 02:32:31 | <null> | <null> | 0 | 159 | 0 | -159 | Unassigned_ Indiana_ US |
| 2 | 90022 | Unassigned | Louisiana | US | 2020-05-28 02:32:31 | <null> | <null> | 84 | 105 | 0 | -21 | Unassigned_ Louisiana_ US |
| 3 | 90024 | Unassigned | Maryland | US | 2020-05-28 02:32:31 | <null> | <null> | 0 | 67 | 0 | -67 | Unassigned_ Maryland_ US |
| 4 | 90032 | Unassigned | Nevada | US | 2020-05-28 02:32:31 | <null> | <null> | 0 | 6 | 0 | -6 | Unassigned_ Nevada_ US |
| 5 | 90033 | Unassigned | New Hampshire | US | 2020-05-28 02:32:31 | <null> | <null> | 10 | 51 | 0 | -41 | Unassigned_ New Hampshire_ US |
| 6 | 90038 | Unassigned | North Dakota | US | 2020-05-28 02:32:31 | <null> | <null> | 0 | 8 | 0 | -8 | Unassigned_ North Dakota_ US |
| 7 | 90056 | Unassigned | Wyoming | US | 2020-05-28 02:32:31 | <null> | <null> | 0 | 13 | 0 | -13 | Unassigned_ Wyoming_ US |
| 8 | <null> | C. Valenciana | Spain | 2020-05-28 02:32:31 | 39.484 | -0.7533 | 11089 | 1332 | 9970 | -213 | C. Valenciana_ Spain | |
| 9 | <null> | Cantabria | Spain | 2020-05-28 02:32:31 | 43.1828 | -3.9878 | 2283 | 202 | 2287 | -206 | Cantabria_ Spain |
If we take any record(index 5) and apply above formula to calculate
Active(-13) = Confirmed(10) - Deaths(51) - Recovered(0)
We could see invalid active cases.
In order to remove it, we’ll apply a Filter to DataFrame to get active values greater than or equal to 0.0.
// Remove invalid active cases by applying filter

PrimitiveDataFrameColumn<bool> activeFilter = covid19Dataframe.Columns[ACTIVE].ElementwiseGreaterThanOrEqual(0.0);
covid19Dataframe = covid19Dataframe.Filter(activeFilter);
display(covid19Dataframe.Description());
| index | Description | FIPS | Lat | Long_ | Confirmed | Deaths | Recovered | Active |
|---|---|---|---|---|---|---|---|---|
| 0 | Length (excluding null values) | 3001 | 3338 | 3338 | 3395 | 3395 | 3395 | 3395 |
| 1 | Max | 99999 | 71.7069 | 178.065 | 370680 | 37460 | 142208 | 229780 |
| 2 | Min | 0 | -52.368 | -164.03539 | 0 | 0 | 0 | 0 |
| 3 | Mean | 27564.82 | 35.48979 | -79.35968 | 1664.4899 | 103.38468 | 505.34668 | 1055.7584 |
As seen above, negative active cases have been removed
6. Visualization
Visualization of data helps business owners make better decisions. The DataFrame maintains data in a tabular format. In order to prepare data for different plots, I have used DataFrame features such as Sum, GroupBy, OrderBy, OrderByDescending etc.
For visualization, I have used open source library called as XPlot.Plotly. Different plots have been used such as Bar, Pie and Line/Scatter Graph.
Global
Collect Data
//  Gets the collection of confirmed, deaths and recovered

var confirmed = covid19Dataframe.Columns[CONFIRMED];
var deaths = covid19Dataframe.Columns[DEATHS];
var recovered = covid19Dataframe.Columns[RECOVERED];

// Gets the sum of collection by using Sum method of DataFrame
var totalConfirmed = Convert.ToDouble(confirmed.Sum());
var totalDeaths = Convert.ToDouble(deaths.Sum());
var totaRecovered = Convert.ToDouble(recovered.Sum());
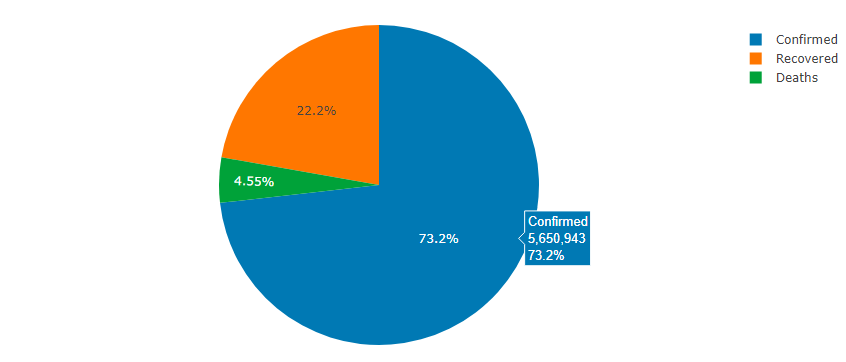
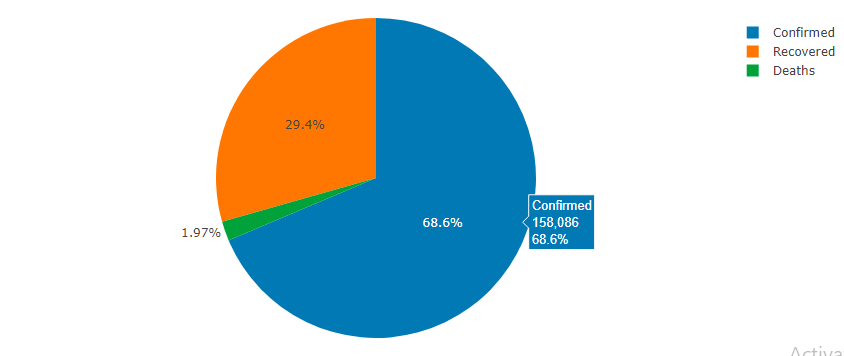
Confirmed Vs Deaths Vs Recovered cases
display(Chart.Plot(
    new Graph.Pie()
    {
        values = new double[]{totalConfirmed, totalDeaths, totaRecovered},
        labels = new string[] {CONFIRMED, DEATHS, RECOVERED}
    }
));
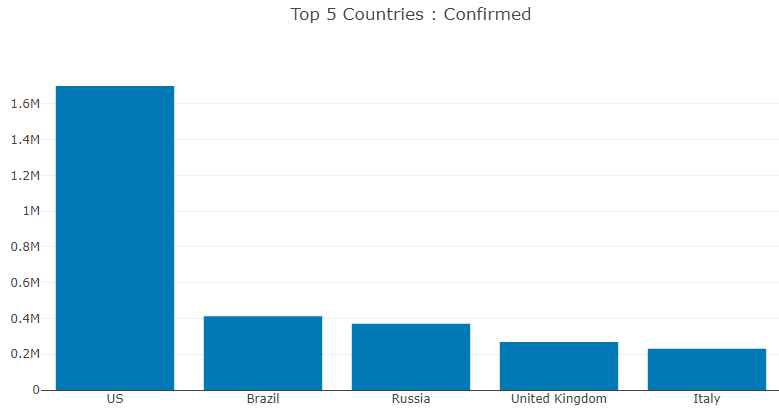
Top 5 Countries with Confirmed cases
In order to get top 5 countries data, I have used DataFrame’s GroupBy, Sum, OrderByDescending methods
// The data for top 5 countries is not present in the csv file.
// In order to get that, first DataFrame's GROUPBY is used aginst the country.
// Then it was aggregated using SUM on Confirmed column.
// In the last, ORDERBYDESCENDING is used to get the top five countries.
var countryConfirmedGroup = covid19Dataframe.GroupBy(COUNTRY).Sum(CONFIRMED).OrderByDescending(CONFIRMED);
var topCountriesColumn = countryConfirmedGroup.Columns[COUNTRY];
var topConfirmedCasesByCountry = countryConfirmedGroup.Columns[CONFIRMED];
HashSet<string> countries = new HashSet<string>(TOP_COUNT);
HashSet<long> confirmedCases = new HashSet<long>(TOP_COUNT);
for(int index = 0; index < TOP_COUNT; index++)
{
countries.Add(topCountriesColumn[index].ToString());
confirmedCases.Add(Convert.ToInt64(topConfirmedCasesByCountry[index]));
}
var title = "Top 5 Countries : Confirmed";
var series1 = new Graph.Bar{
        x = countries.ToArray(),
        y = confirmedCases.ToArray()
    };

var chart = Chart.Plot(new []{series1});
chart.WithTitle(title);
display(chart);
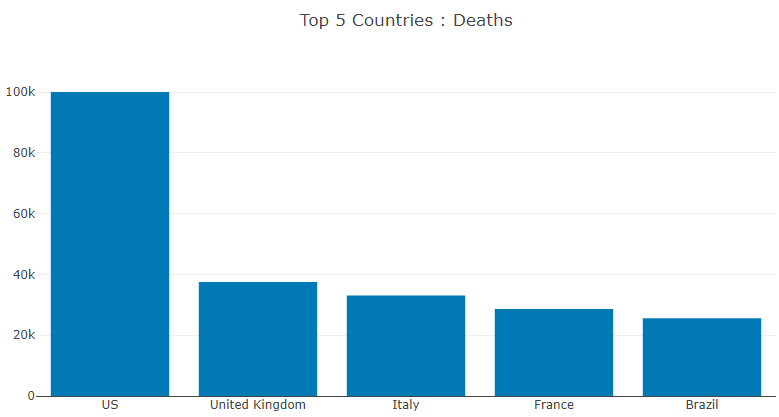
Top 5 Countries with Deaths
// Get the data
var countryDeathsGroup = covid19Dataframe.GroupBy(COUNTRY).Sum(DEATHS).OrderByDescending(DEATHS);
var topCountriesColumn = countryDeathsGroup.Columns[COUNTRY];
var topDeathCasesByCountry = countryDeathsGroup.Columns[DEATHS];

HashSet<string> countries = new HashSet<string>(TOP_COUNT);
HashSet<long> deathCases = new HashSet<long>(TOP_COUNT);
for(int index = 0; index < TOP_COUNT; index++)
{
    countries.Add(topCountriesColumn[index].ToString());
    deathCases.Add(Convert.ToInt64(topDeathCasesByCountry[index]));
}
var title = "Top 5 Countries : Deaths";
var series1 = new Graph.Bar{
        x = countries.ToArray(),
        y = deathCases.ToArray()
    };

var chart = Chart.Plot(new []{series1});
chart.WithTitle(title);
display(chart);
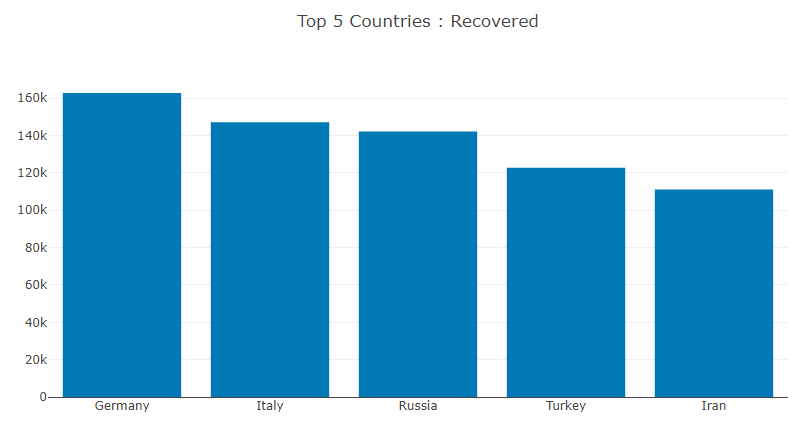
Top 5 Countries with Recovered cases
// Get the data
var countryRecoveredGroup = covid19Dataframe.GroupBy(COUNTRY).Sum(RECOVERED).OrderByDescending(RECOVERED);
var topCountriesColumn = countryRecoveredGroup.Columns[COUNTRY];
var topRecoveredCasesByCountry = countryRecoveredGroup.Columns[RECOVERED];

HashSet<string> countries = new HashSet<string>(TOP_COUNT);
HashSet<long> recoveredCases = new HashSet<long>(TOP_COUNT);
for(int index = 0; index < TOP_COUNT; index++)
{
    countries.Add(topCountriesColumn[index].ToString());
    recoveredCases.Add(Convert.ToInt64(topRecoveredCasesByCountry[index]));
}
var title = "Top 5 Countries : Recovered";
var series1 = new Graph.Bar{
        x = countries.ToArray(),
        y = recoveredCases.ToArray()
    };

var chart = Chart.Plot(new []{series1});
chart.WithTitle(title);
display(chart);
India
Confirmed Vs Deaths Vs Recovered cases
Filtering on Country column with INDIA as value
// Filtering on Country column with INDIA as value

PrimitiveDataFrameColumn<bool> indiaFilter = covid19Dataframe.Columns[COUNTRY].ElementwiseEquals(INDIA);
var indiaDataFrame = covid19Dataframe.Filter(indiaFilter);

var indiaConfirmed = indiaDataFrame.Columns[CONFIRMED];
var indiaDeaths = indiaDataFrame.Columns[DEATHS];
var indiaRecovered = indiaDataFrame.Columns[RECOVERED];

var indiaTotalConfirmed = Convert.ToDouble(indiaConfirmed.Sum());
var indiaTotalDeaths = Convert.ToDouble(indiaDeaths.Sum());
var indiaTotaRecovered = Convert.ToDouble(indiaRecovered.Sum());
display(Chart.Plot(
    new Graph.Pie()
    {
        values = new double[]{indiaTotalConfirmed, indiaTotalDeaths, indiaTotaRecovered},
        labels = new string[] {CONFIRMED, DEATHS, RECOVERED}
    }
));
Conclusion
I hope you have enjoyed reading the notebook, and might have got some idea on the powerful features of DataFrame in .Net. Data science capabilities are emerging fast in the .Net ecosystem which abstracts lot of complexity present in the field. The focus of this notebook is data analysis and there is nothing present from a Machine Learning perspective such as making a prediction. In Part-2, I have done time series analysis and predictions using ML.Net
Source Code: https://github.com/praveenraghuvanshi/covid-19
If you liked it, please like/comment at Comments. It’ll encourage me to write more.
Contact
LinkedIn : https://in.linkedin.com/in/praveenraghuvanshi
Github : https://github.com/praveenraghuvanshi
Twitter : @praveenraghuvan
References
- Using ML.NET in Jupyter notebooks
- An Introduction to DataFrame
- DataFrame - Sample
- Getting started with ML.NET in Jupyter Notebooks
- Tips and tricks for C# Jupyter notebook
- Jupyter notebooks with C# and R running
- Data analysis using F# and Jupyter notebook — Samuele Resca
- Exploring the C# Dataframe API by Jon Wood
- Coronavirus-COVID-19-Visualization-Prediction
- Data Modelling & Analysing Coronavirus (COVID19) Spread using Data Science & Data Analytics in Python Code